Yaesu FT-2000 Roofing FiltersN2PK VNA Transmission Mode Plots Following are VNA measurements overlaid offering a comparison of the stock filters vs. NS prototype SN002. Details for each scan are noted . 3 KHz Yaesu Stock Roofing Filter AnalysisBelow, the +/-2 KHz points (vertical red lines) are equal spaced around the center frequency of the NS filter to make the illustrations more clear. These 2 KHz points are important because that demonstrates the attenuation the adjacent IMD products generated by the mixer are located. The Yaesu filter provides only a few db of suppression. The NS filter; about 20 db. The prototype SN002 is about 500 Hz high which is why my tests show higher DR3 numbers on the lower side than above. The Yaesu 3 KHz filter CF by contrast is about 1 KHz low; however, it's so wide the error does not significantly affect the 2 KHz test results but does give more favorable numbers with larger offsets - slanted toward the high frequency side as the plots would indicate. The production NS filters will be within about 100 Hz of true CF. And should offer approximately 25db of attenuation at the +/- 2 KHz points. That will serve to push the DR3 numbers even higher than what the prototypes have measured. And with the tight CF, the performance will be essentially the same above/below the center frequency. 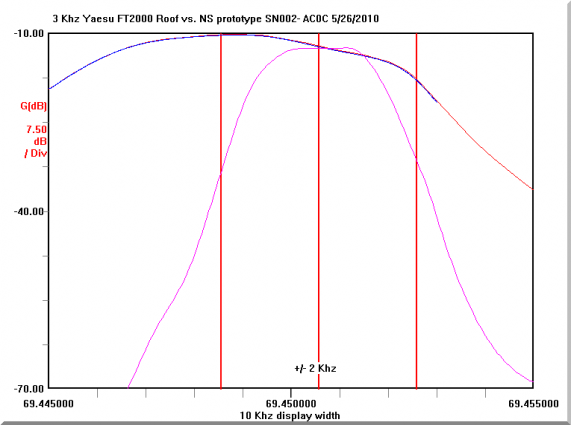
In this 30 KHz span, the comparison of the two filters really stands out. 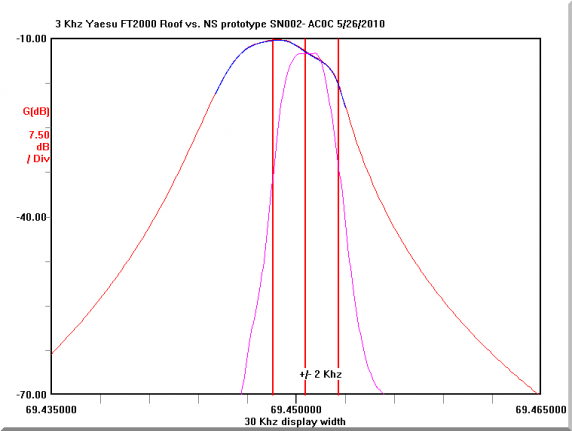
Looking more closely at the 3 KHz filter now, this 100 KHz wide span shows the ultimate attenuation to be quite good. Unfortunately, it requires signals of roughly 40 KHz spacing to realize the full benefit of the 3 KHz roofing filter. 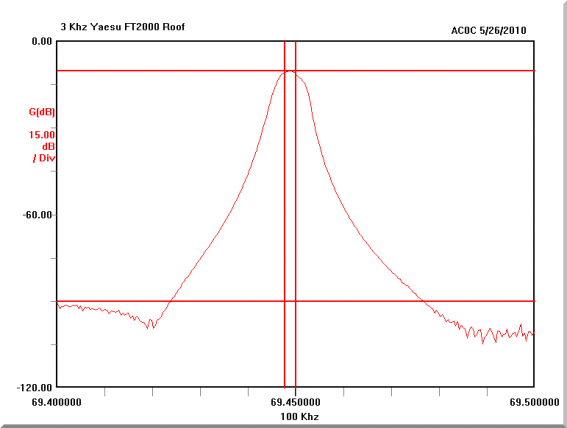
The 3 KHz roof, over a 40 KHz frequency span with the -60 db points calculated. 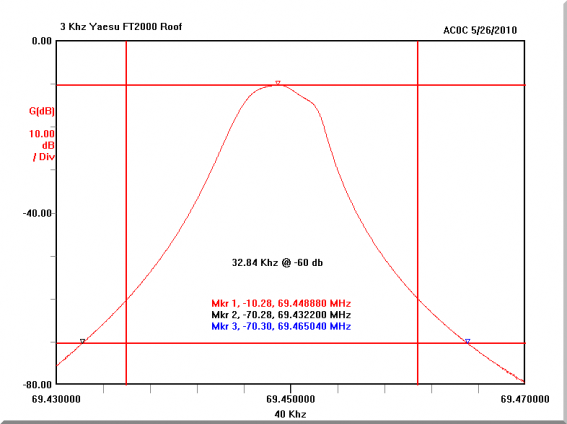
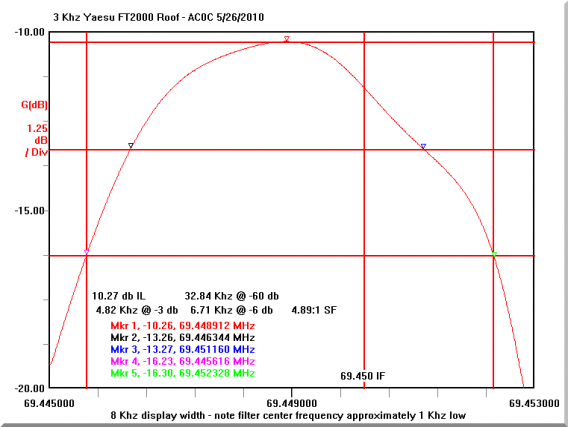
The 3 KHz roof, over the 15 KHz frequency span. Here, -3db and -6 db points are measured: 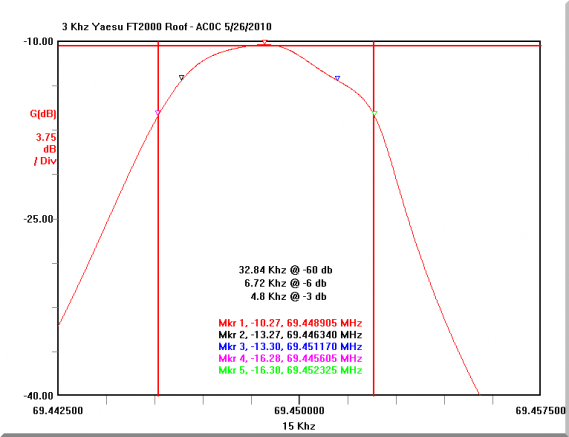
And finally, the statistics of the filter are revealed in this final chart. - 6.71 KHz wide at -6db and a nearly 5:1 shape factor.
- Off center approximately 1 KHz low.
- 10 db insertion loss.
6 KHz Yaesu FT-2000 Stock Roofing Filter Analysis Scans of the 6 kHz filter were made with the filter isolated from other circuitry. Insertion loss is 9.25 db; about 1db less than the 3 kHz filter. -6db bandwidth measured 7.76 KHz which was a surprise. Extrapolation from the scans done by I4SBX in the past had showed a slightly more narrow top end for the 6 kHz filter than the 3 kHz . Here, the 3 is slightly more narrow than the 6. This could be unit-to-unit variation or measurement method differences. In any event, the 3 and 6 KHz stock filters have a very similar transmission characteristic. 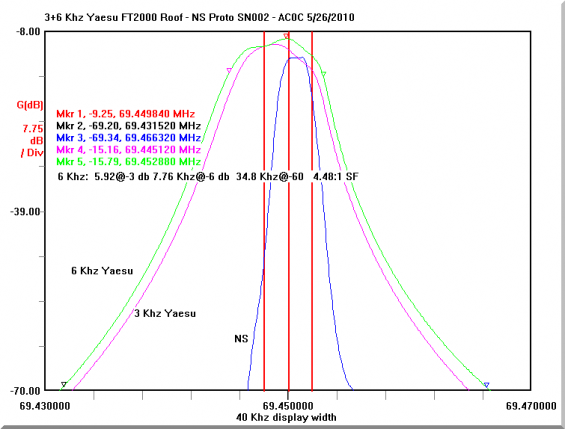
Looking closely at the top end, the passband is quite irregular. Both the 3 KHz and 6 kHz units are sloped more aggressively on the upper side vs. the lower. The lack of symmetry is interesting. The center frequency of the 6 KHz filter, based on the -6db point measurements, is also about 1 kHz low. 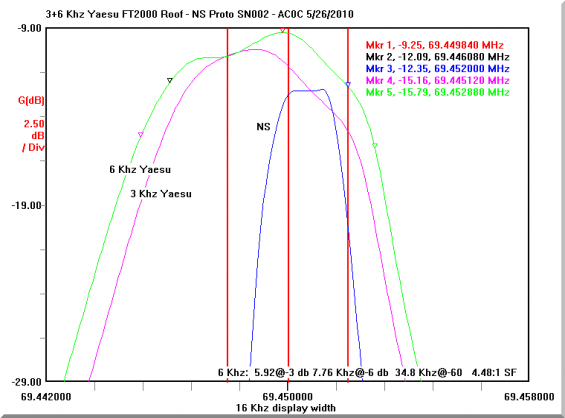
15 KHz FT-2000 Stock Roofing Filter AnalysisThe output side traces for this filter are wide and difficult to access. To get a clean scan, the trace needs to be cut and for this filter, I just could not get enough of the trace cut to break the output free of the following matching nets. The result is that the output is swamped greatly and the insertion loss overstated. I would expect the IL for this filter to be in the 6-8 db range and here it measures about 30db showing the swamping effect of the network. For this same reason, the passband ripple may be exaggerated. Earlier I was able to perform a similar test with the 6 KHz filter (with and without the output side matching net) - the plot shapes were about the same, with only the insertion loss greatly affected. For that reason, I think the general shape indicated here is likely to be close to what the filter would test in the isolated case. Due to the high levels of ripple, the -3db half-power point measurement was meaningless. The -6db passband width was measured at 18.9 KHz. What is interesting is that the slope of the transition band is essentially the same as the other two filters suggesting they all 3 are of the similar structure. Center frequency looks to be shifted down as is the case with the other two stock filters. 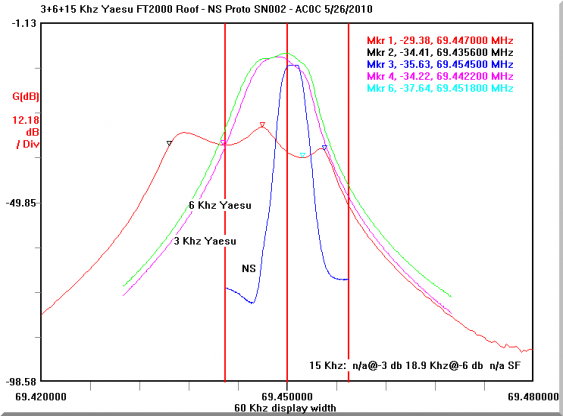
|